df  |>
 ggplot(aes(x=date, y=count)) +
  geom_area(alpha=0.4) +
  geom_smooth(se=FALSE) +
  theme_minimal() +
  labs(x=NULL, y=NULL, title="Cocnur T2 bookings in March 2025")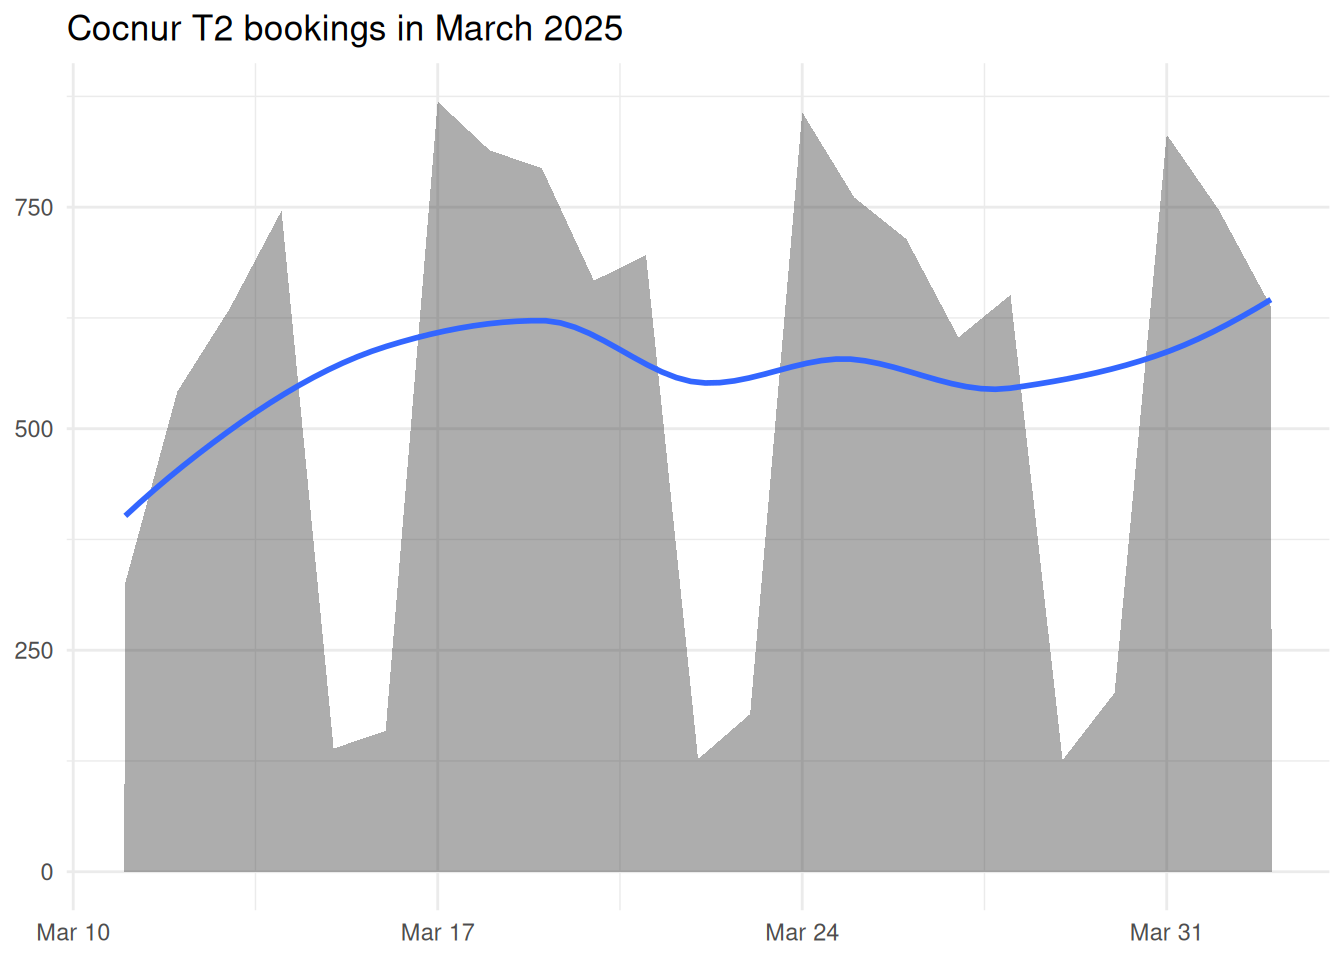
df |>
ggplot(aes(x=date, y=count)) +
geom_area(alpha=0.4) +
geom_smooth(se=FALSE) +
theme_minimal() +
labs(x=NULL, y=NULL, title="Cocnur T2 bookings in March 2025")