library(palmerpenguins)Day 17: Birds
Exploring penguins’ mass distribution
Classig ggplot /w faceting
penguins |>
  mutate(island = fct_rev(island)) |>
  ggplot(aes(x=body_mass_g)) +
  geom_density(aes(color = species, fill=species), alpha=0.25, size=1) +
  # change order of facets
  facet_wrap(~island, nrow=3) +
  scale_color_brewer(palette = "Set1") + scale_fill_brewer(palette = "Set1") +
  scale_y_continuous(labels = NULL, breaks = NULL) + ylab(NULL) +
  theme(
    legend.position = c(1, 1),
    legend.justification = c(1, 1),
    legend.direction = "horizontal",
    legend.title = element_blank(),
    legend.background = element_rect(fill="lightgrey"))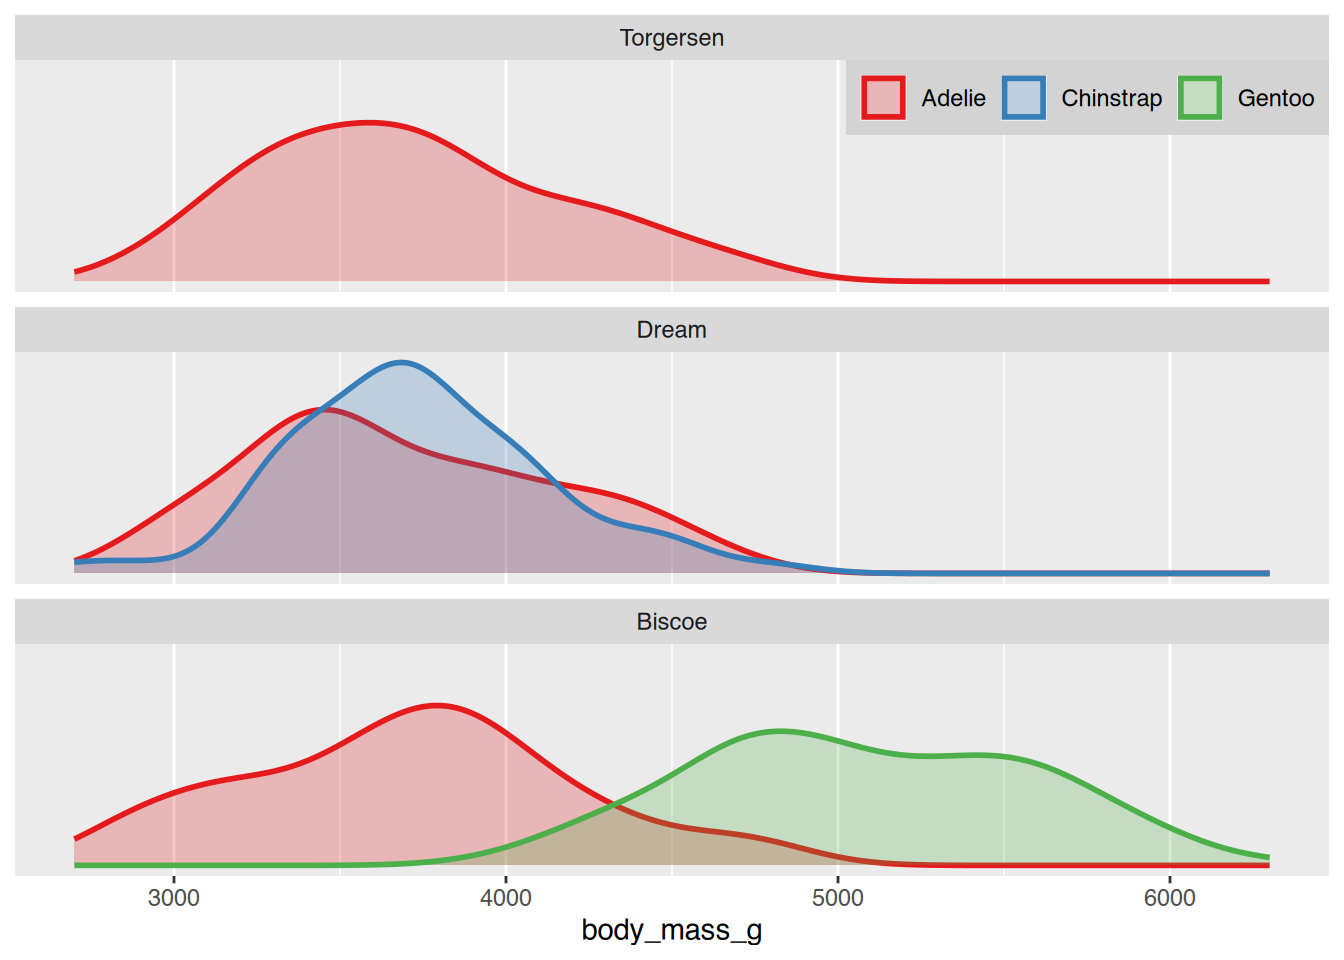
Using ggridges
penguins |>
  ggplot(aes(x=body_mass_g, y=island)) +
  geom_density_ridges(aes(color = species, fill=species), alpha=0.5, size=1) +
  theme_ridges() +
  # position legend inside the plot in right upper corner
  theme(legend.position = c(1, 1), legend.justification = c(1, 1), legend.direction = "horizontal", legend.title = element_blank())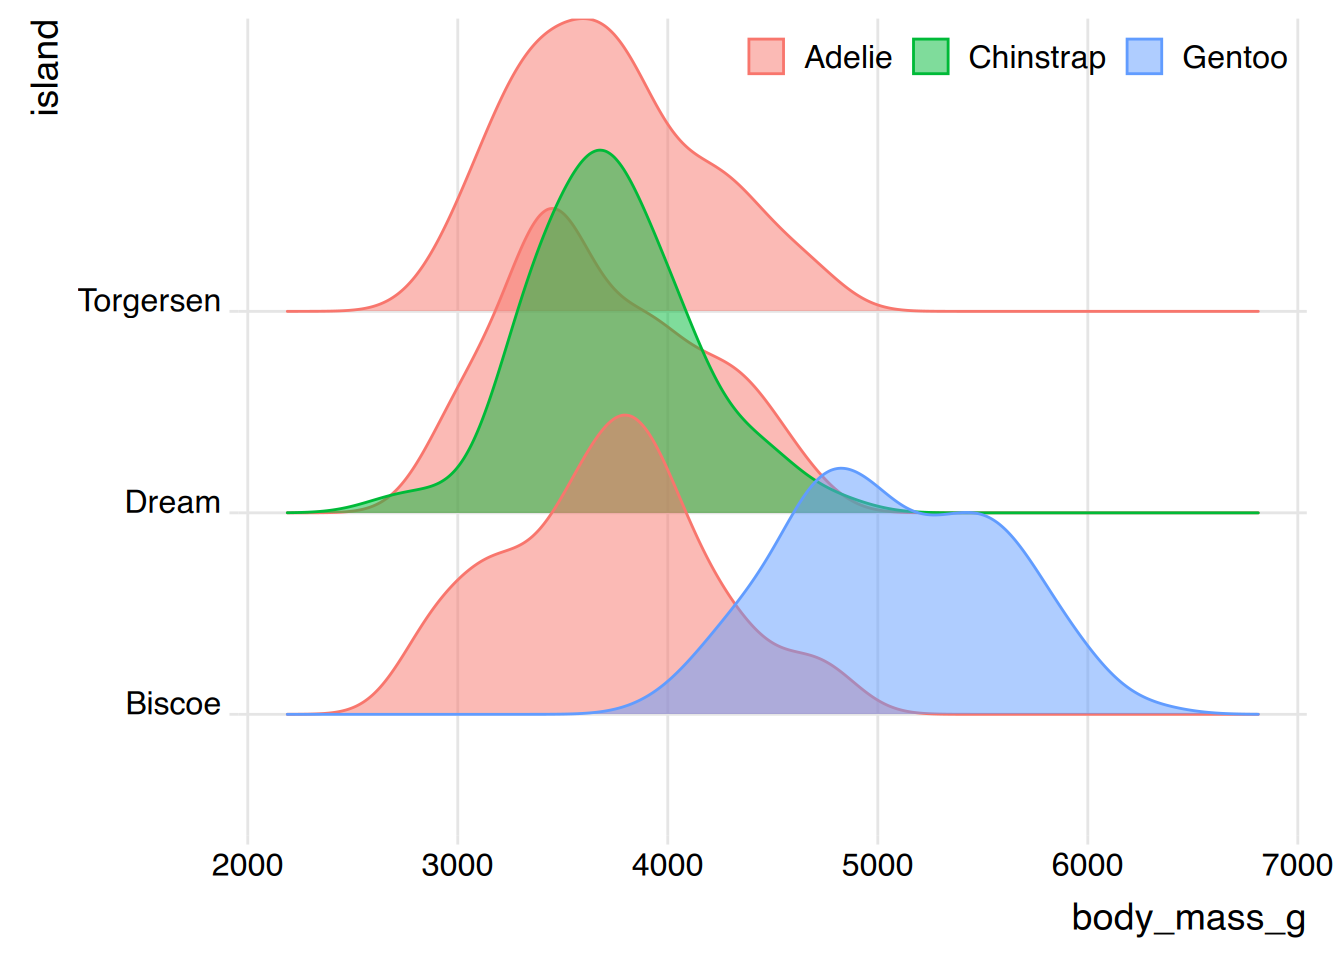
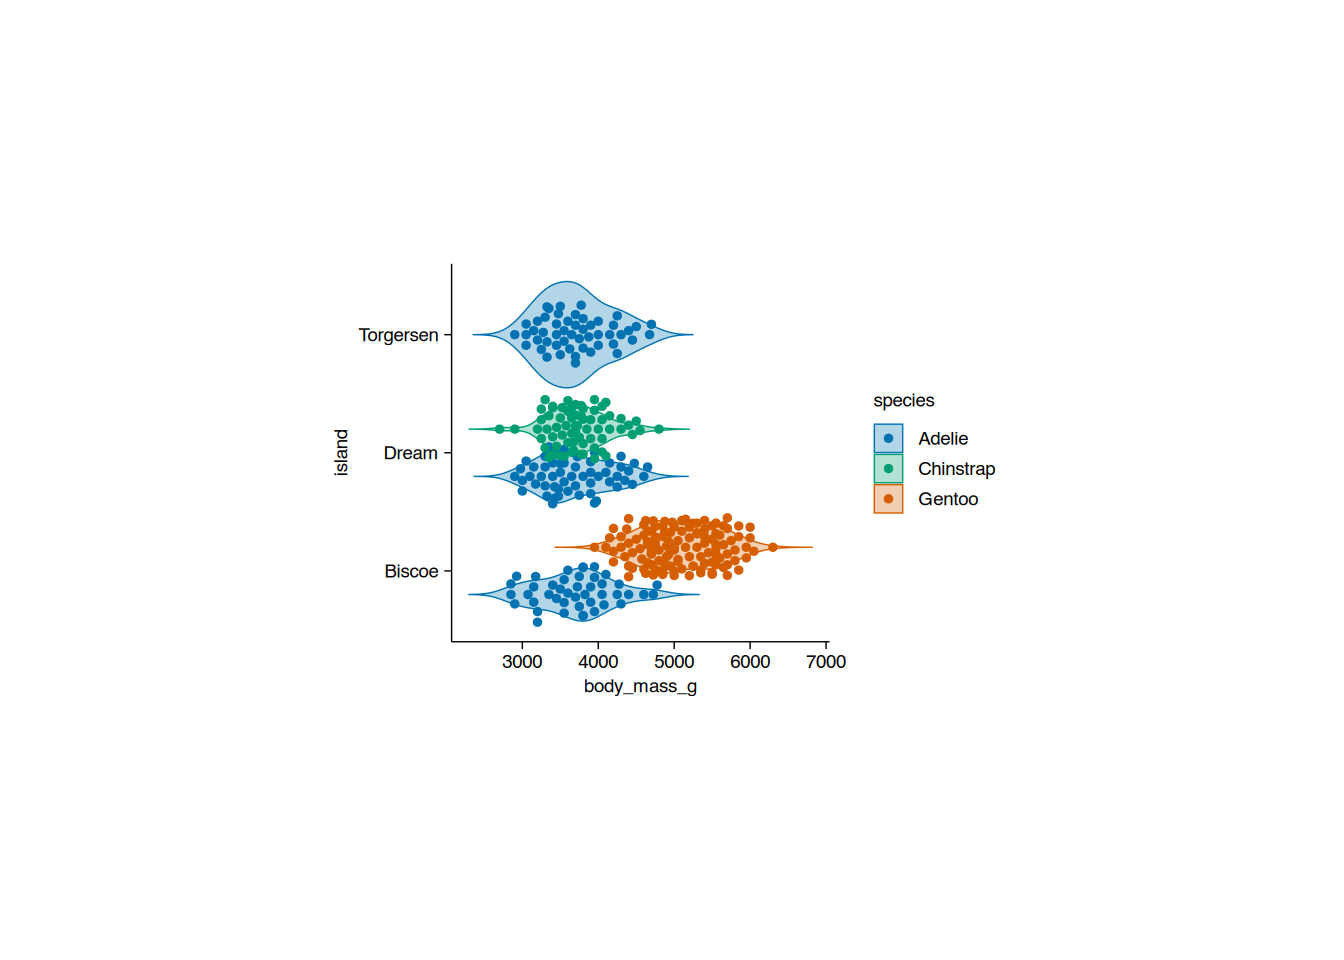
Bonus: Using tidyplots
penguins |> tidyplot(y=island, x = body_mass_g, fill=species) |> add_violin() |> add_data_points_beeswarm()